

Last week in the market, Bitcoin and HYPE moved in two completely different trends. On October 30, the Binance hack caused Bitcoin to fall 4.12% in a single day, briefly breaking below the lower rail of the descending channel intraday, then quickly pulled back, reaching a low of $76,265, only about $135 away from the 0.382 Fibonacci retracement level. On the same day, HYPE held the $75 short-term watershed, and boosted by positive news, its maximum single-day gain approached 20%, with the high nearing an all-time high. This week's review continues to track using daily wave analysis and 4-hour Chan Theory structure: whether Bitcoin's daily wave ⅰ correction is nearing its end, and after HYPE forms a new structure, where the pullback would be a suitable dip-buying position.
Summary of core trading views for this week:
• Bitcoin daily-level trend structure analysis (see Part 1 for details)
• Bitcoin hourly-level trend structure analysis (see Part 2 for details)
• Bitcoin this week's market forecast and medium- and short-term trading strategies (see Part 3 for details)
• HYPE hourly-level trend structure analysis (see Part 4 for details)
• HYPE this week's market forecast and short-term trading strategies (see Part 5 for details)
I. Bitcoin Daily-Level Trend Structure Analysis
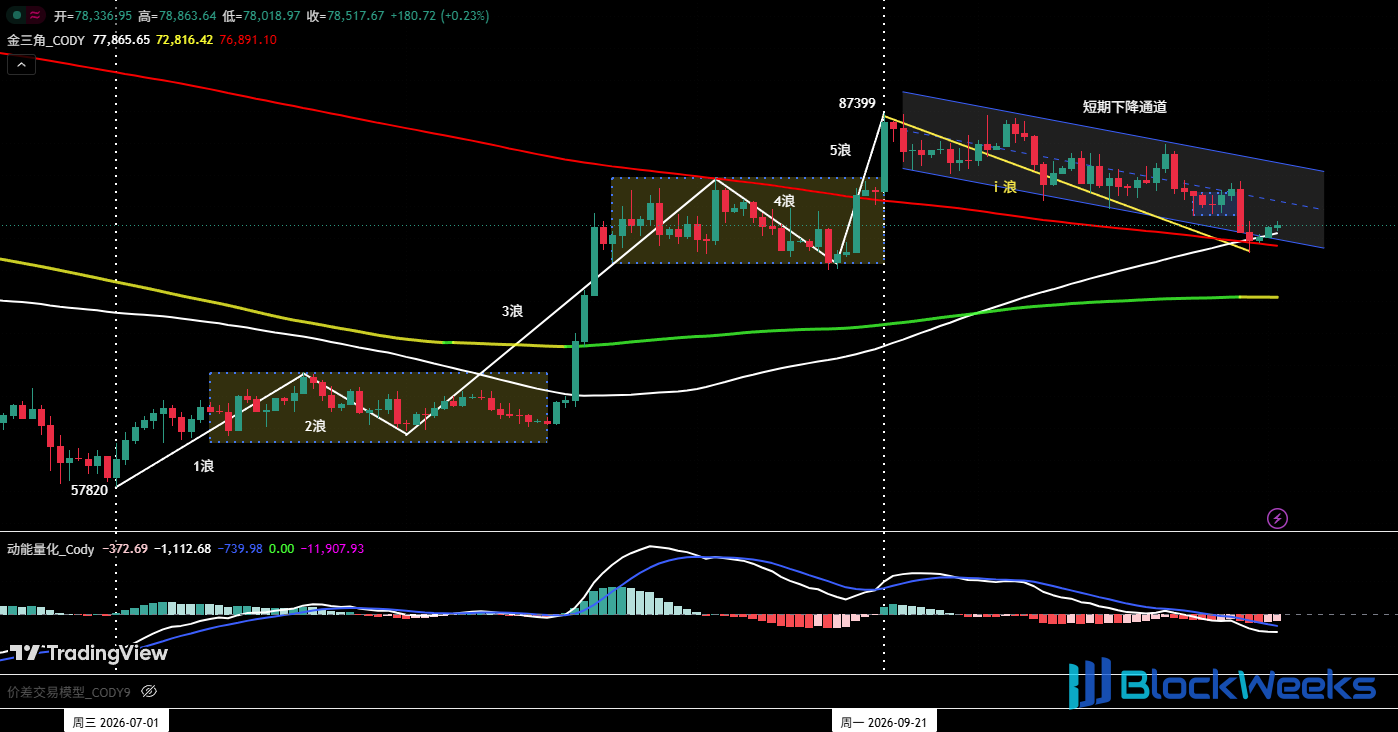
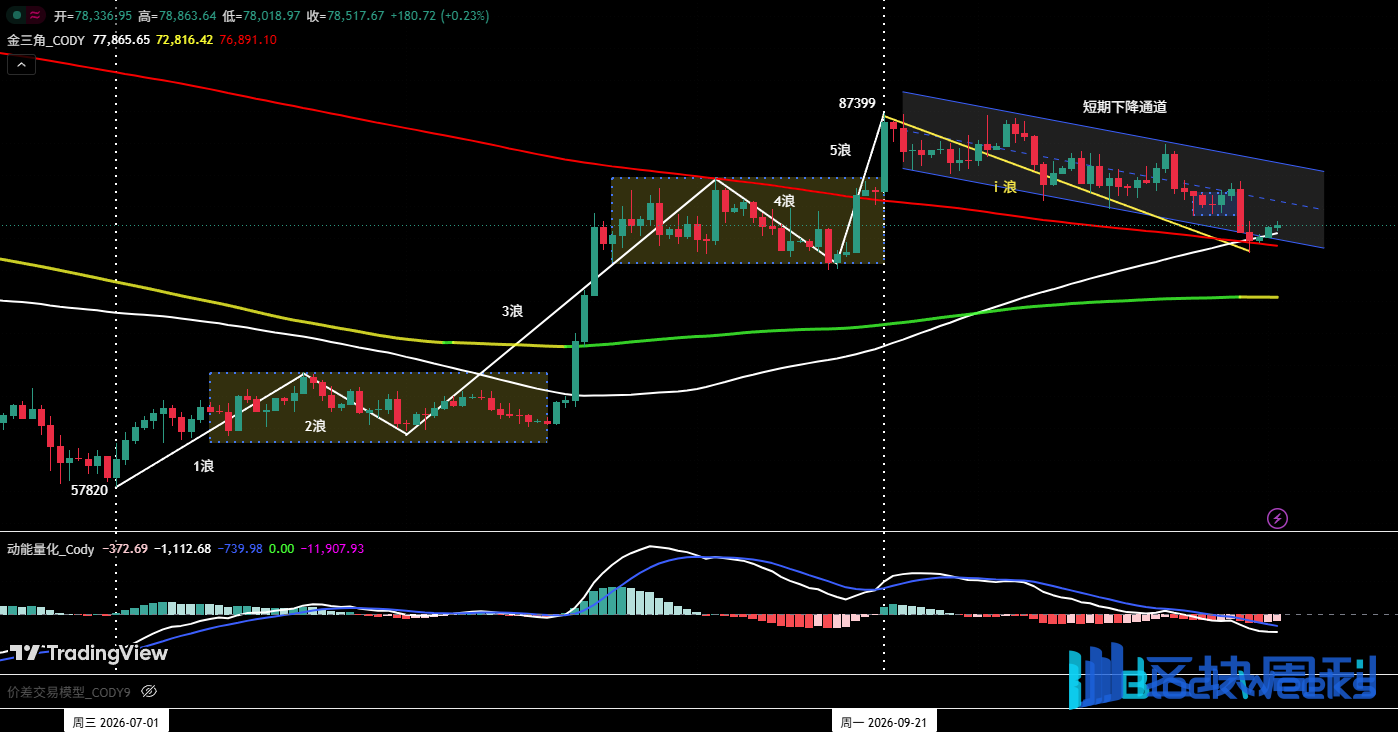
Figure 1 Bitcoin daily candlestick chart
1. Review of last week's forecast
①. At that time, the price was running along a short-term descending channel. The lower rail of the channel was formed by connecting the two staged lows on September 24 and October 15, and the upper rail was formed by drawing a line parallel to the lower rail based on the October 5 high.
②. The daily-level correction that began from the September 21 high was expected to unfold in a three-wave structure, and it is currently running within the wave ⅰ correction.
Judging from the actual price action, the market is moving in the direction predicted.
2. Analysis of the current trend structure
①. "Pin bar" breakdown, lower rail support is effective
On October 30, Bitcoin fell rapidly under the impact of sudden negative news, recording a daily bearish candle with a 4.12% decline. It is worth noting that the price briefly broke below the lower rail of the descending channel intraday and was then quickly pulled back, and it is still running above the lower rail of the channel. This "false breakout + quick recovery" pin bar pattern indicates that there is strong support at the lower rail.
②. Moving average resonance zone forms multiple support
As shown in Figure 1, two important moving averages (white line and red line) crossed near $77,200, forming important support for the price.
③. Fibonacci retracement levels
From the July 1 low of $57,820 to the September 21 high of $87,399, the price has completed a full five-wave upward structure, with a cumulative gain of 51.2% (about $29,579).
Using this as the measurement basis, the Fibonacci retracement levels are as follows:
• 0.382 retracement: $76,130
• 0.500 retracement: $72,610
• 0.618 retracement: $69,120
Last week's correction reached a low of around $76,265, only about $135 above the 0.382 retracement level, which has basically met the conditions for a wave ⅰ pullback.
④. Bottom area determination
Overall, the correction that began on September 21 has entered the bottom area. After a short-term rebound, a second bottom may form, and it cannot be ruled out that the price may once again break below $76,265; but regardless of whether it breaks down, it is a high-probability event that the daily wave ⅰ correction will end in the $75,000–$76,500 area, and there is no need to panic at this position.
3. Daily correction three-wave framework (projection)
①. Wave ⅰ (correction wave): September 21 to present
• Starting point: $87,399
• Has run for 41 trading days (still ongoing)
• Maximum decline within the range: 12.73%
②. After the wave ⅰ correction ends, a wave ⅱ rebound is expected, followed by a possible wave ⅲ correction (terminal correction wave)
II. Bitcoin Hourly-Level Trend Structure Analysis
In last week's review, we systematically analyzed the 4-hour trend structure based on the Chan Theory system. After a week of movement, what changes have appeared in the market? Below is continued tracking and in-depth interpretation.
Figure 2 Bitcoin _4-hour candlestick chart
1. Seven-segment correction upgraded to nine-segment decline
As shown in the figure, last week's review projected that if the endpoint 9 of the subsequent pullback segment no longer broke below endpoint 7, then the probability that the daily correction would end at endpoint 7 was relatively high; otherwise, the market might continue to probe lower. Judging from last week's actual price action, under the impact of negative market news, panic selling appeared, and the (8-9) segment fell rapidly in an almost vertical manner, not only breaking below endpoint 7 but also once probing to $76,265 before temporarily stabilizing and rebounding. At this point, in the 4-hour framework, the correction has extended from seven segments to nine segments, further lengthening the correction time.
2. Panorama of the current 4-hour trend structure
①. Complete structure division
The daily correction that began from the September 21 high of $87,399 (endpoint 0) can be divided on the 4-hour chart into a ten-segment correction structure from (0-1) to (9-10).
②. Construction and positioning of the descending pivot
• Pivot construction: Based on the overlap of the five segments from (1-2) to (5-6), a standard descending pivot is formed.
• Spatial positioning: Pivot upper rail: about $84,361; lower rail: about $82,556.
③. Analysis of momentum and volume dimensions
The current (9-10) rebound segment is in progress, and the bottom signals need to be examined from two dimensions:
• Volume dimension (red bar area): Comparing the correction segments (6-7) and (8-9), in the "Momentum Quantitative Model," the red bar areas corresponding to them have clearly formed a volume bottom divergence.
• Momentum dimension (white indicator line): The white signal lines corresponding to them have not yet shown a bottom divergence, i.e., while the coin price made a new low, the momentum indicator also simultaneously made a new low.
3. Comprehensive assessment:
Because the bottom signals from the two dimensions have not resonated, the coin price may still see back-and-forth movement at this position. However, from the perspective of a larger cycle, the coin price has now completed a nine-segment downward structure, the correction time has already been satisfied, and the probability that the daily-level wave i correction ends above $75,000 is extremely high.
III. Bitcoin's Market Forecast and Trading Strategy for This Week
1. BTC Market Trend Forecast for This Week
Core view for this week: Focus on the ending position of the daily-level wave i correction and the subsequent wave ii rebound.
2. Core Resistance Levels
• First resistance zone: around $79,200 (previous important level)
• Second resistance zone: around $82,500–$84,500 (previous important level)
• Third resistance zone: around $87,500 (previous important level)
3. Core Support Levels
• First support level: around $75,000 (previous important support level)
• Second support level: $69,100–$70,500 zone (previous important support level)
4. Trading Strategy for This Week (excluding the impact of sudden news)
①. Medium-term strategy:
Figure 3 Bitcoin _ Daily K-Line Chart (Position Monitoring Model)
Position Monitoring Model:
• Stay in cash and observe: As shown in Figure 3, the current trend is a deep pullback phase after the coin price broke through the "long-short channel," and the chart shows that the coin price has not yet issued an effective stop-falling signal at the lower rail of the channel. Therefore, the medium-term strategy is mainly to stay in cash and observe.
• Market verification of the trading strategy: The current pullback trend strongly verifies the correctness of the previous principles of "do not chase rallies, stay in cash for the medium term and observe, and wait for pullback signals."
②. Short-term strategy: Use 30% of the position, set stop-loss points, and based on support and resistance levels, look for "price spread" opportunities. (Use 30-minute/60-minute as the operating cycle).
③. In short-term operations, combined with the analysis of the current trend structure, this week's strategy is mainly to "go long on dips." We have prepared the following A/B trading plans in advance.
• Plan A: Light-position test long in the strong support zone.
• Entry: If this week the coin price shows a clear stop-falling and stabilizing pattern in the $75,000–$76,500 zone, and the quantitative model simultaneously issues a bottom signal, a light long position can be established, with the position controlled within 30%.
• Risk control: Set an initial stop-loss level.
• Exit: When the rebound reaches near an important resistance level and combined with model signals, positions can be closed in batches to take profits.
• Plan B: Light-position test long in the lower support zone.
• Entry: If the $75,000 support is lost, when the correction reaches the next support zone of $72,500–$73,000 and shows a clear stop-falling and stabilizing pattern, and the quantitative model simultaneously issues a bottom signal, a light long position can be established, with the position controlled within 30%.
• Risk control: Set an initial stop-loss level.
• Exit: When the rebound reaches near an important resistance level and combined with model signals, positions can be closed in batches to take profits.
IV. HYPE Hourly-Level Trend Structure Analysis
In last week's review, we conducted an in-depth analysis of HYPE's trend structure from two perspectives, the weekly chart and the 4-hour level, and clearly stated that the support near $75 is the short-term watershed for the price at that moment, and based on "whether it is effectively broken below," we gave two trend scenarios. Last week's actual trend verified the "bullish path," that is, last week, with the strong support at $75 plus the catalyst of favorable market news, the price launched a strong upward attack at this position; on October 29 alone, the maximum intraday gain was nearly 20%, and the highest price approached an all-time high.
Below, we will further analyze the current trend structure within the 4-hour framework based on changes in the market.
Figure 4 HYPE_4-Hour K-Line Chart
1. Decomposition of the daily-level correction in the 4-hour chart
As shown in Figure 4: The daily-level correction that HYPE began from the September 23 high of $97.98 can be decomposed in the 4-hour chart into a seven-segment downward structure from (89-90) to (95-96).
2. Construction of the descending central zone
①. The central zone is constructed by the overlap of three segments: (90-91), (91-92), and (92-93);
②. Central zone range: upper rail $88.07, lower rail $84.54;
③. (89-90) is the entry segment into the central zone, and (93-94), (94-95), and (95-96), three segments in total, constitute the extension of the exit segment from the central zone.
3. Resonance of bottom signals at endpoint 96
Comparing correction segments (93-94) and (95-96), the self-built "Momentum Quantitative Model" shows that the volume bottom divergence (red bar area) signal and the momentum bottom divergence (white indicator line) signal resonate at endpoint 96, directly triggering the strong rebound of segment (96-97).
4. Confirmation of short-term reversal
The upward segment (96-97) rose strongly, breaking through the high at endpoint 91 in one move and approaching an all-time high. Based on this, it is determined that the daily-level correction that started from the September 23 high of $97.98 has ended at $75, and a new daily-level trend structure is currently in progress.
V. HYPE Weekly Market Forecast and Short-Term Trading Strategy
1. HYPE Weekly Price Trend Forecast
①. Core Resistance Levels:
• First resistance level: $97–$100 range
• Second resistance level: around $105
②. Core Support Levels:
• First support level: $84.5–$88 range
• Second support level: $75–$77 range
• Third support level: $68–$70 range
③. Core View for This Week:
This week, the key focus is to observe whether the price correction can stop falling and stabilize in the $84–$88 range.
2. HYPE Short-Term Trading Strategy for This Week
For short-term trading this week, the core idea is "do not chase highs; try light long positions on dips." The specific strategy is as follows:
①. Stabilization within the central range, try light long positions:
If the price stops falling and stabilizes in the $84.5–$88 range and continues to rise, those with no position may consider trying light long positions, with position size controlled within 30%, targeting the first resistance level of $97–$100 range, while setting a stop-loss and strictly executing it.
②. Go long on stabilization at lower support level:
If the price loses the $84.5 support, then adjusts to the $80–$82 range and forms a stabilization, those with no position may consider trying light long positions, with position size controlled within 30%, setting a stop-loss and strictly executing it.
VI. Special Notes
1. When opening a position: immediately set an initial stop-loss level.
2. When profit reaches 1%: move the stop-loss to the entry cost price (break-even point) to ensure principal safety.
3. When profit reaches 2%: move the stop-loss to the position of 1% profit.
4. Continuous tracking: thereafter, for every additional 1% profit in the coin price, move the stop-loss synchronously by 1%, dynamically protecting and locking in gains.
Financial markets change rapidly, and all market analyses and trading strategies require dynamic adjustment. All views, analytical models, and operational strategies involved in this article originate from personal technical analysis and are solely for personal trading journal purposes, and do not constitute any investment advice or operational basis. Markets carry risks, and investment requires caution; please do not make decisions based on this.