


DOT price has fallen toward $1 as Polkadot launches its native dotUSD stablecoin, with daily support under pressure and a rounded top forming on the 4-hour chart.
Summary
- DOT price traded near $1.03, with Binance’s daily chart showing a decline of roughly 7.6%.
- Daily Fibonacci support sits at $1.017, followed by $0.949 if selling continues.
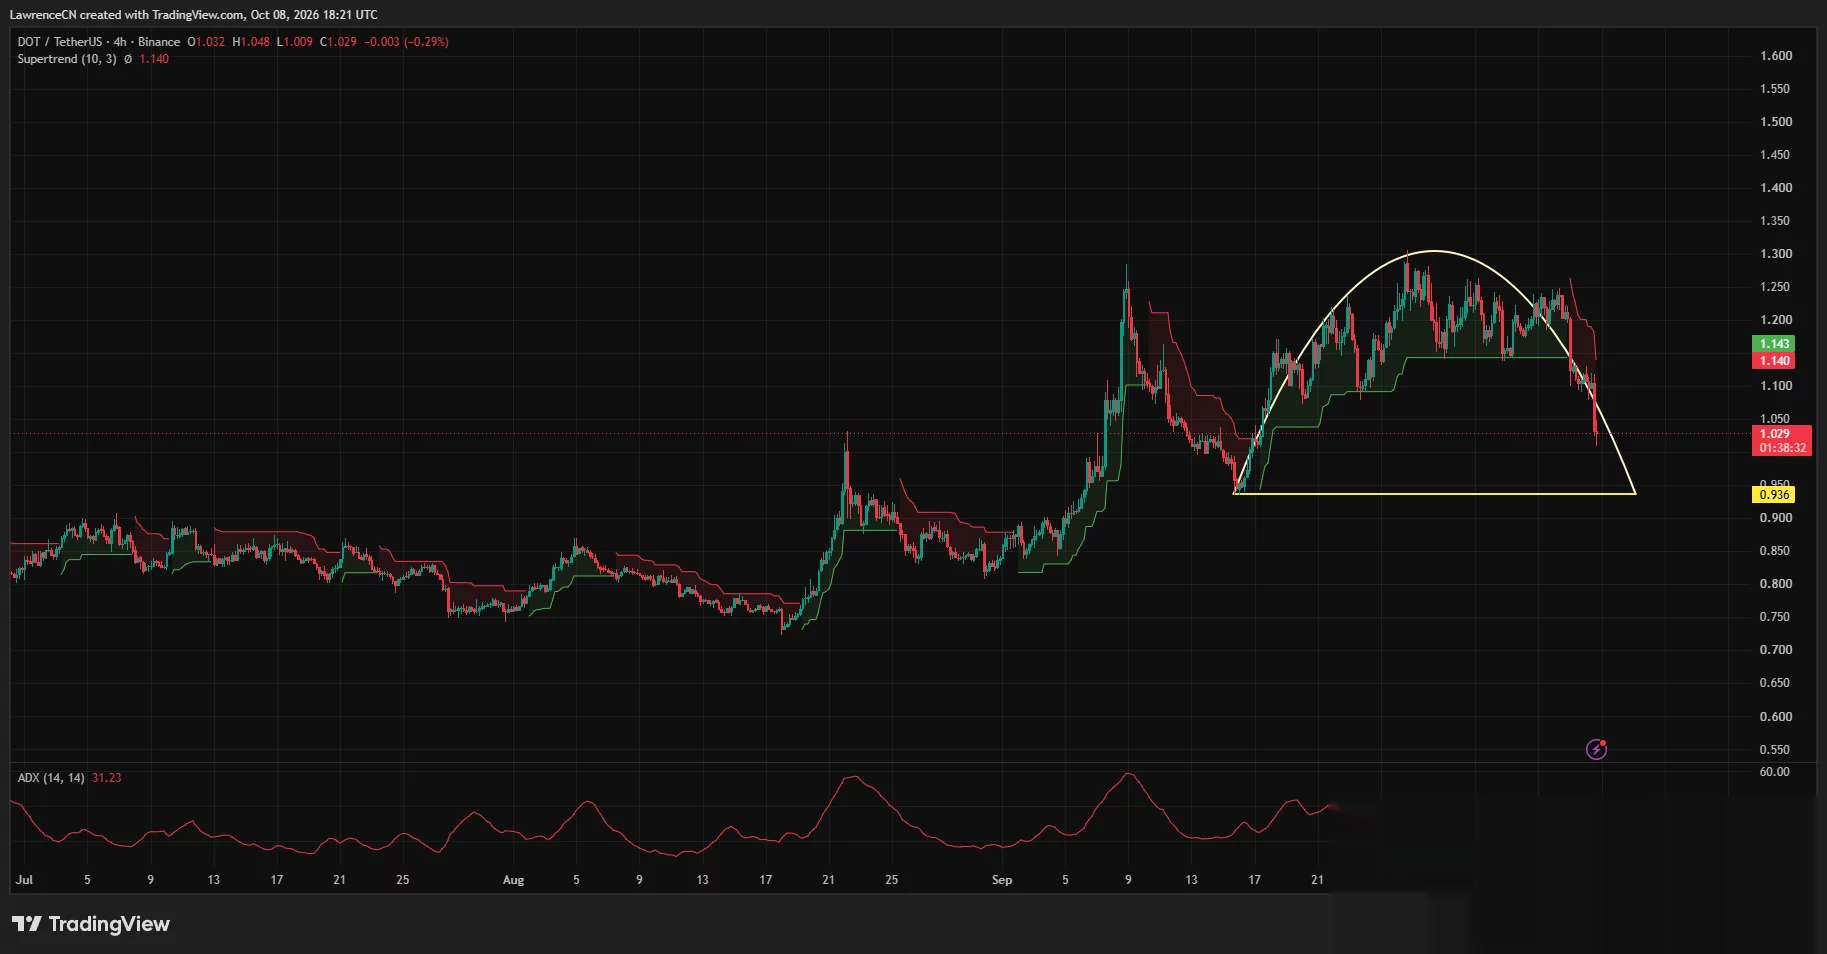
- The 4-hour chart shows a rounded top above a horizontal floor near $0.936.
- dotUSD starts with USDT backing, while DOT-backed borrowing remains part of a later rollout.
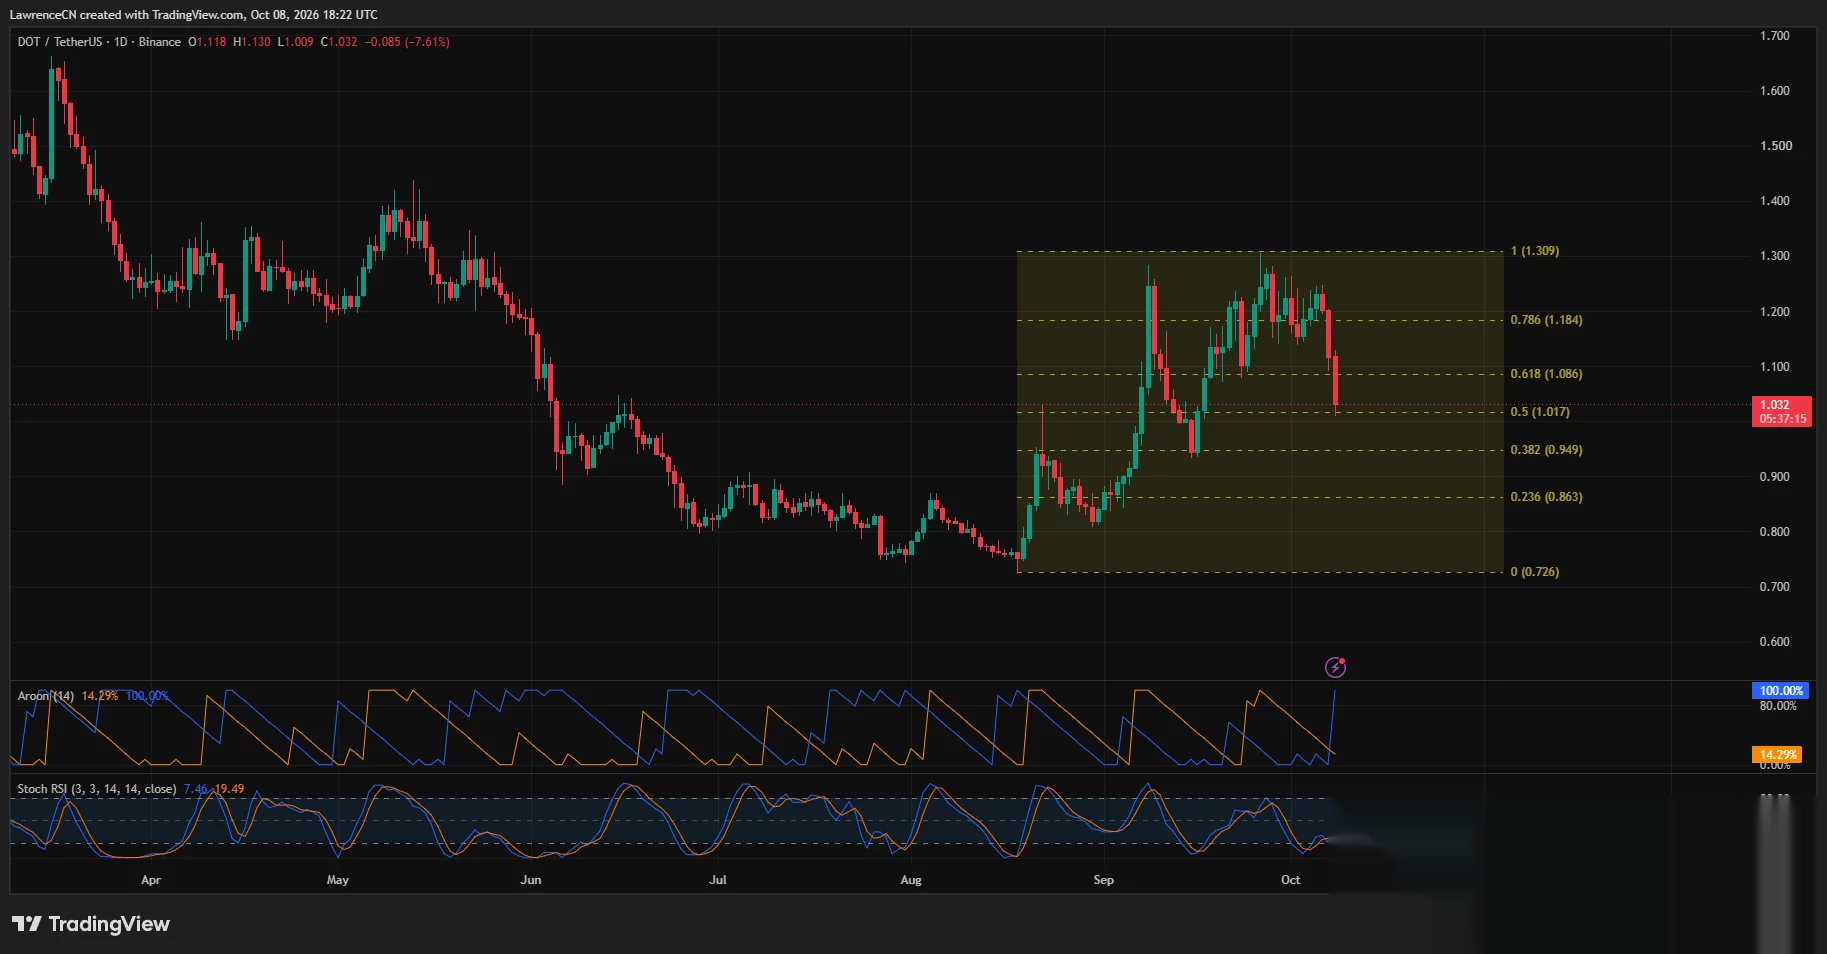
TradingView’s Binance DOT/USDT daily chart showed Polkadot trading at $1.032 on Oct. 8, after reaching a session high of $1.130 and a low of $1.009. The decline brought DOT close to the halfway retracement of its recovery from $0.726 to $1.309.
The latest chart reading also placed DOT roughly 21% below that $1.309 peak. On the 4-hour timeframe, the token traded near $1.029 after losing the support that had held beneath much of its late-September recovery.
DOT price approaches the $1.017 retracement
The daily TradingView chart places the 50% Fibonacci retracement at $1.017, just below the latest price. DOT’s session low of $1.009 briefly took it beneath that line before the price returned above it.
That leaves $1.009–$1.017 as the immediate area to watch, with the $1 psychological level directly below. A sustained move beneath this zone would put the next marked Fibonacci support, $0.949, into focus.
The $0.949 level represents the 38.2% retracement of the recovery shown on the chart. Below it, the next marked levels are $0.863 and the August low near $0.726.
On the upside, the daily chart places the 61.8% retracement at $1.086. DOT has fallen below that level, making it the first marked recovery hurdle above the current price.
A move back above $1.086 would bring the $1.184 retracement into view, followed by the $1.309 peak. The chart therefore shows a clear sequence of recovery levels rather than an immediate return to September’s highs.
Daily momentum readings also favor sellers. The Aroon readings show Aroon Down at 100% and Aroon Up at 14.29%, consistent with a recent low occurring much more recently than a comparable high.
The Stochastic RSI lines stand at 7.46 and 19.49, both below the usual 20 threshold. Those readings place the indicator in oversold territory, although the faster line remains beneath the slower line.
A rounded top puts $0.936 in focus
TradingView’s 4-hour DOT chart shows a rounded-top formation spanning the recovery from mid-September into early October. Price climbed from around $0.936 toward $1.30 before rolling over and falling through successive support areas.
The formation’s horizontal base sits at $0.936, approximately 9% below the latest 4-hour price. DOT remains above that floor, so the chart shows a developing bearish formation rather than a completed break beneath its base.
The daily support at $0.949 sits close to the 4-hour floor at $0.936. Together, those levels form a nearby support band if DOT loses its current position around $1.
The 4-hour Supertrend has turned red, with its active line at $1.140. Price is trading below that line after falling beneath the earlier green support around $1.143.
A recovery toward $1.14 would therefore encounter both the current Supertrend resistance and the area where the preceding upward trend lost support. Reclaiming that zone would improve the short-term chart structure before the higher daily resistance at $1.184.
The 4-hour Average Directional Index stands at 31.23 and has risen during the latest decline. ADX measures trend strength rather than direction; alongside falling price and the red Supertrend, its reading supports the strength of the current downward move.
dotUSD launches with USDT backing first
Polkadot announced that dotUSD had reached mainnet under its OpenGov governance system. Referendum 1944’s executed proposal establishes a protocol-owned asset and treasury-funded DOT/dotUSD liquidity.
The proposal allocates $2.5 million in USDT to mint dotUSD and $2.5 million worth of DOT to seed the pool. It also allows users to hold dotUSD without keeping DOT in the same account.
According to the referendum, the first phase permits one-for-one minting against USDT, subject to a cap, without price oracles, borrowing vaults, or liquidation machinery. A later phase would introduce DOT collateral, oracles, a stability pool and liquidation and redemption mechanisms.
The design draws from Liquity v2 and would let borrowers select their interest rates, with lower-rate positions facing redemption first. The Polkadot Community Foundation states that it will not issue, operate, or custody the stablecoin or user collateral.
For U.S. dollar exposure, the proposal describes dotUSD as dollar-pegged, while its initial backing remains USDT. DOT-backed issuance belongs to the planned second phase.
Earlier bullish commentary faces lower prices
In an Oct. 6 post, analyst Sujul said DOT was compressing above a resistance level and suggested that the narrowing range could precede a strong expansion.
The latest TradingView charts show that the subsequent move has been downward, with DOT near $1.03 and below its 4-hour Supertrend. The daily $1.017 level is now the closest marked support, while $1.086 is the first recovery hurdle.
Holding the $1 area would leave room for a rebound toward that hurdle. A sustained loss of $1.009–$1.017 would instead bring the closely spaced $0.949 and $0.936 supports into focus.