

Cardano price traded near $0.269 on Oct. 5 after breaking above $0.26 and reaching $0.2768, while analysts on X identified $0.275–$0.28 as the next resistance area and $0.264 as a possible pullback level.
Summary
- Cardano price reached $0.2768 before easing toward $0.269, remaining above its recent trading range.
- Daily money flow stayed positive, with price above all four tracked simple moving averages.
- CoinGlass showed liquidation concentrations near $0.266 and $0.257, below the latest trading price.
- Analysts identified $0.28 as a short-term target and $0.2887 as a longer-term confirmation level.
TradingView’s Binance ADA/USDT daily chart placed Cardano at $0.2686, while the 4-hour chart recorded $0.2688. Both showed a high of $0.2768, followed by a retreat from the session’s peak.
The latest advance extended a recovery from roughly $0.14 in late June. On the daily chart, ADA has since moved through its longer-term moving averages and returned to price levels last seen around May.
Cardano clears $0.26 as daily money flow stays positive
TradingView’s daily chart showed ADA trading above its 20-day simple moving average at $0.2417, its 50-day average at $0.2211, its 100-day average at $0.1971 and its 200-day average at $0.2132.
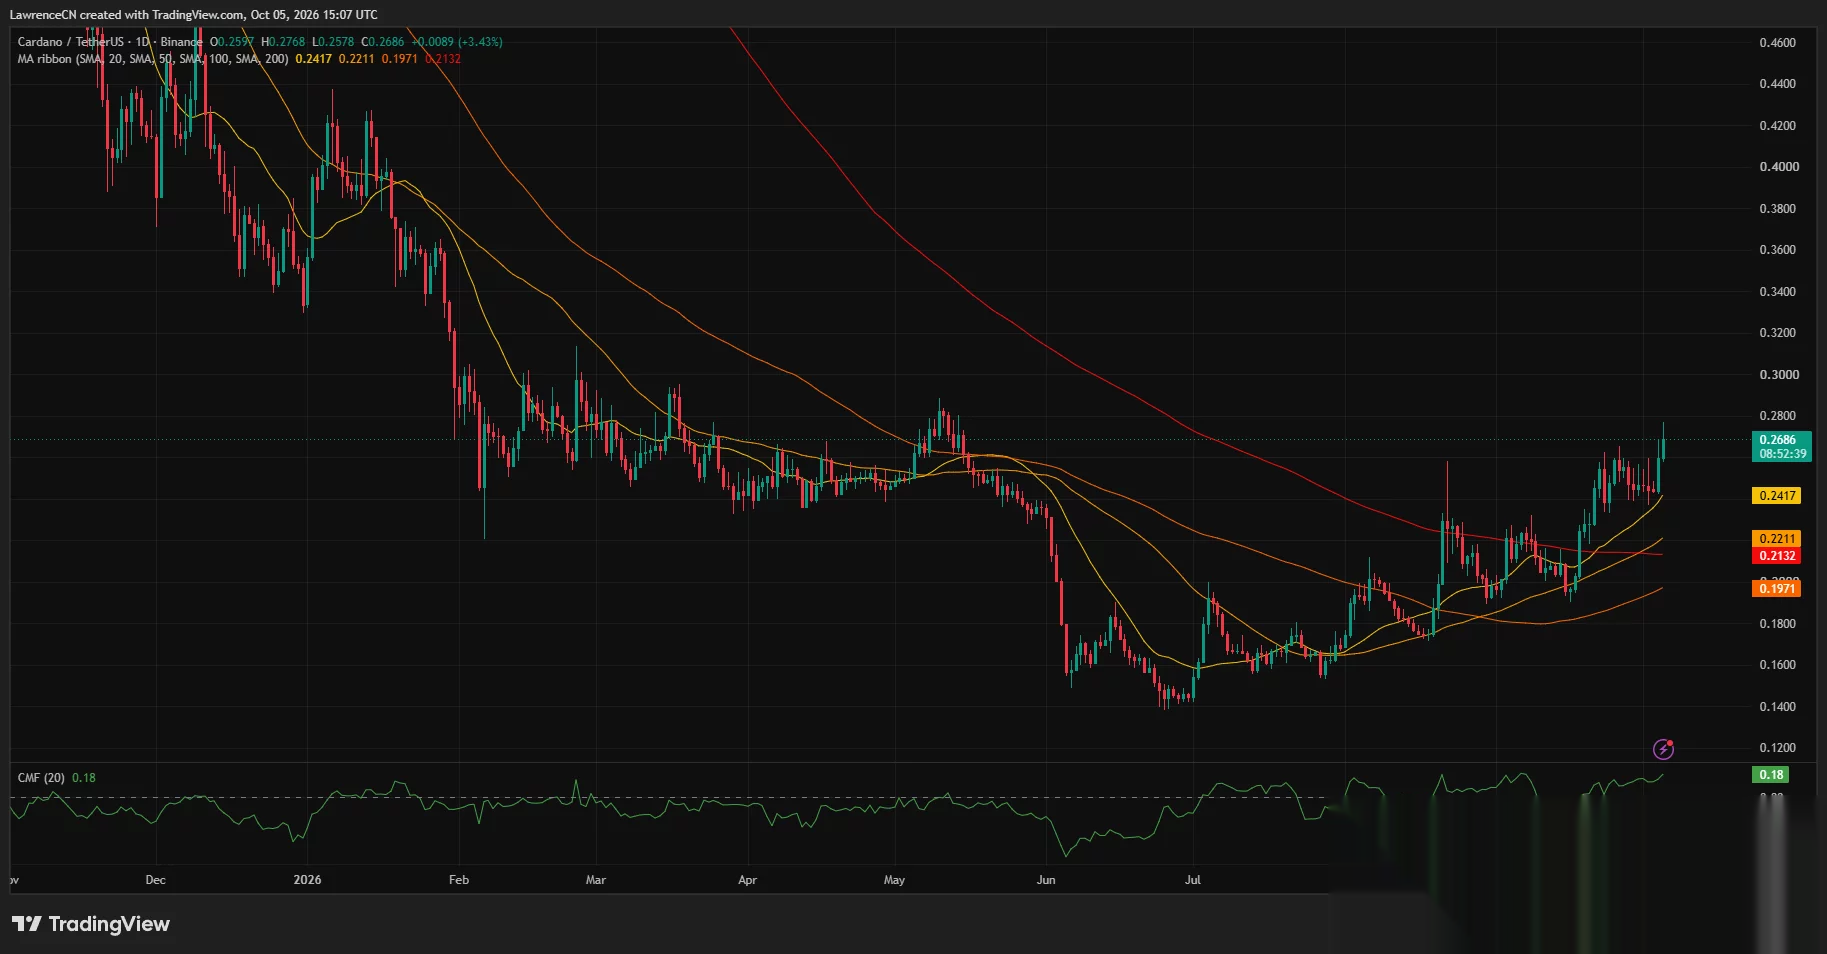
The 20-day average was above the other three readings, while the 50-day average also stood above the 200-day average. The 100-day average remained below the 200-day line, leaving the longer-term averages in a different order from the shorter-term pair.
At $0.2686, ADA traded about 11% above its 20-day average and 26% above its 200-day average. The daily price structure showed a sharp September advance followed by trading around $0.24–$0.26 before the latest push higher.
The same chart recorded Chaikin Money Flow at 0.18. A reading above zero indicates positive buying pressure under the indicator’s volume-based calculation, adding a positive money-flow signal to the move above the recent range.
The daily chart’s next visible historical price area sits around $0.28–$0.29, where ADA traded during earlier rallies in February, March, and May. The latest high of $0.2768 remained below that area.
Below the breakout, the daily chart placed the nearest tracked moving average at $0.2417. The 50-day and 200-day averages formed a lower reference area around $0.213–$0.221, with the 100-day average farther below at $0.1971.
Analysts put $0.27 and $0.2887 at the center of the setup
Analyst Alex Marzell described ADA’s breakout from a range between $0.242 and $0.247. He said one hourly candle had gained 6% on roughly 20 times the range’s normal volume.
In his Oct. 5 post, Marzell identified $0.275 as resistance after three rejections and made $0.27 the dividing line for his short-term outlook.
“As long as $0.27 holds I think $0.275 gets taken out and $0.28 opens up.”
The analyst put $0.264 as the retest level if ADA lost $0.27. TradingView’s later 4-hour reading of $0.2688 placed the token below his stated threshold after its move to $0.2768.
Crypto Patel focused on the two-week chart and identified $0.2887 as his bullish confirmation level. His Oct. 5 post said ADA was about 98% above his accumulation zone.
Patel’s longer-term scenario required a sustained higher-timeframe close above $0.2887. He listed targets of $0.50, $1, $2, $3 and $5, making those projections conditional on confirmation above his trigger.
His threshold was about 7.4% above the $0.2688 TradingView reading. Marzell’s nearer $0.28 target was about 4.2% above the same price, placing the two analysts’ confirmation levels on different timeframes.
Liquidation bands gather below $0.27
CoinGlass’s 24-hour ADA liquidation heatmap showed price rising from approximately $0.247 to above $0.275 before pulling back toward $0.268.
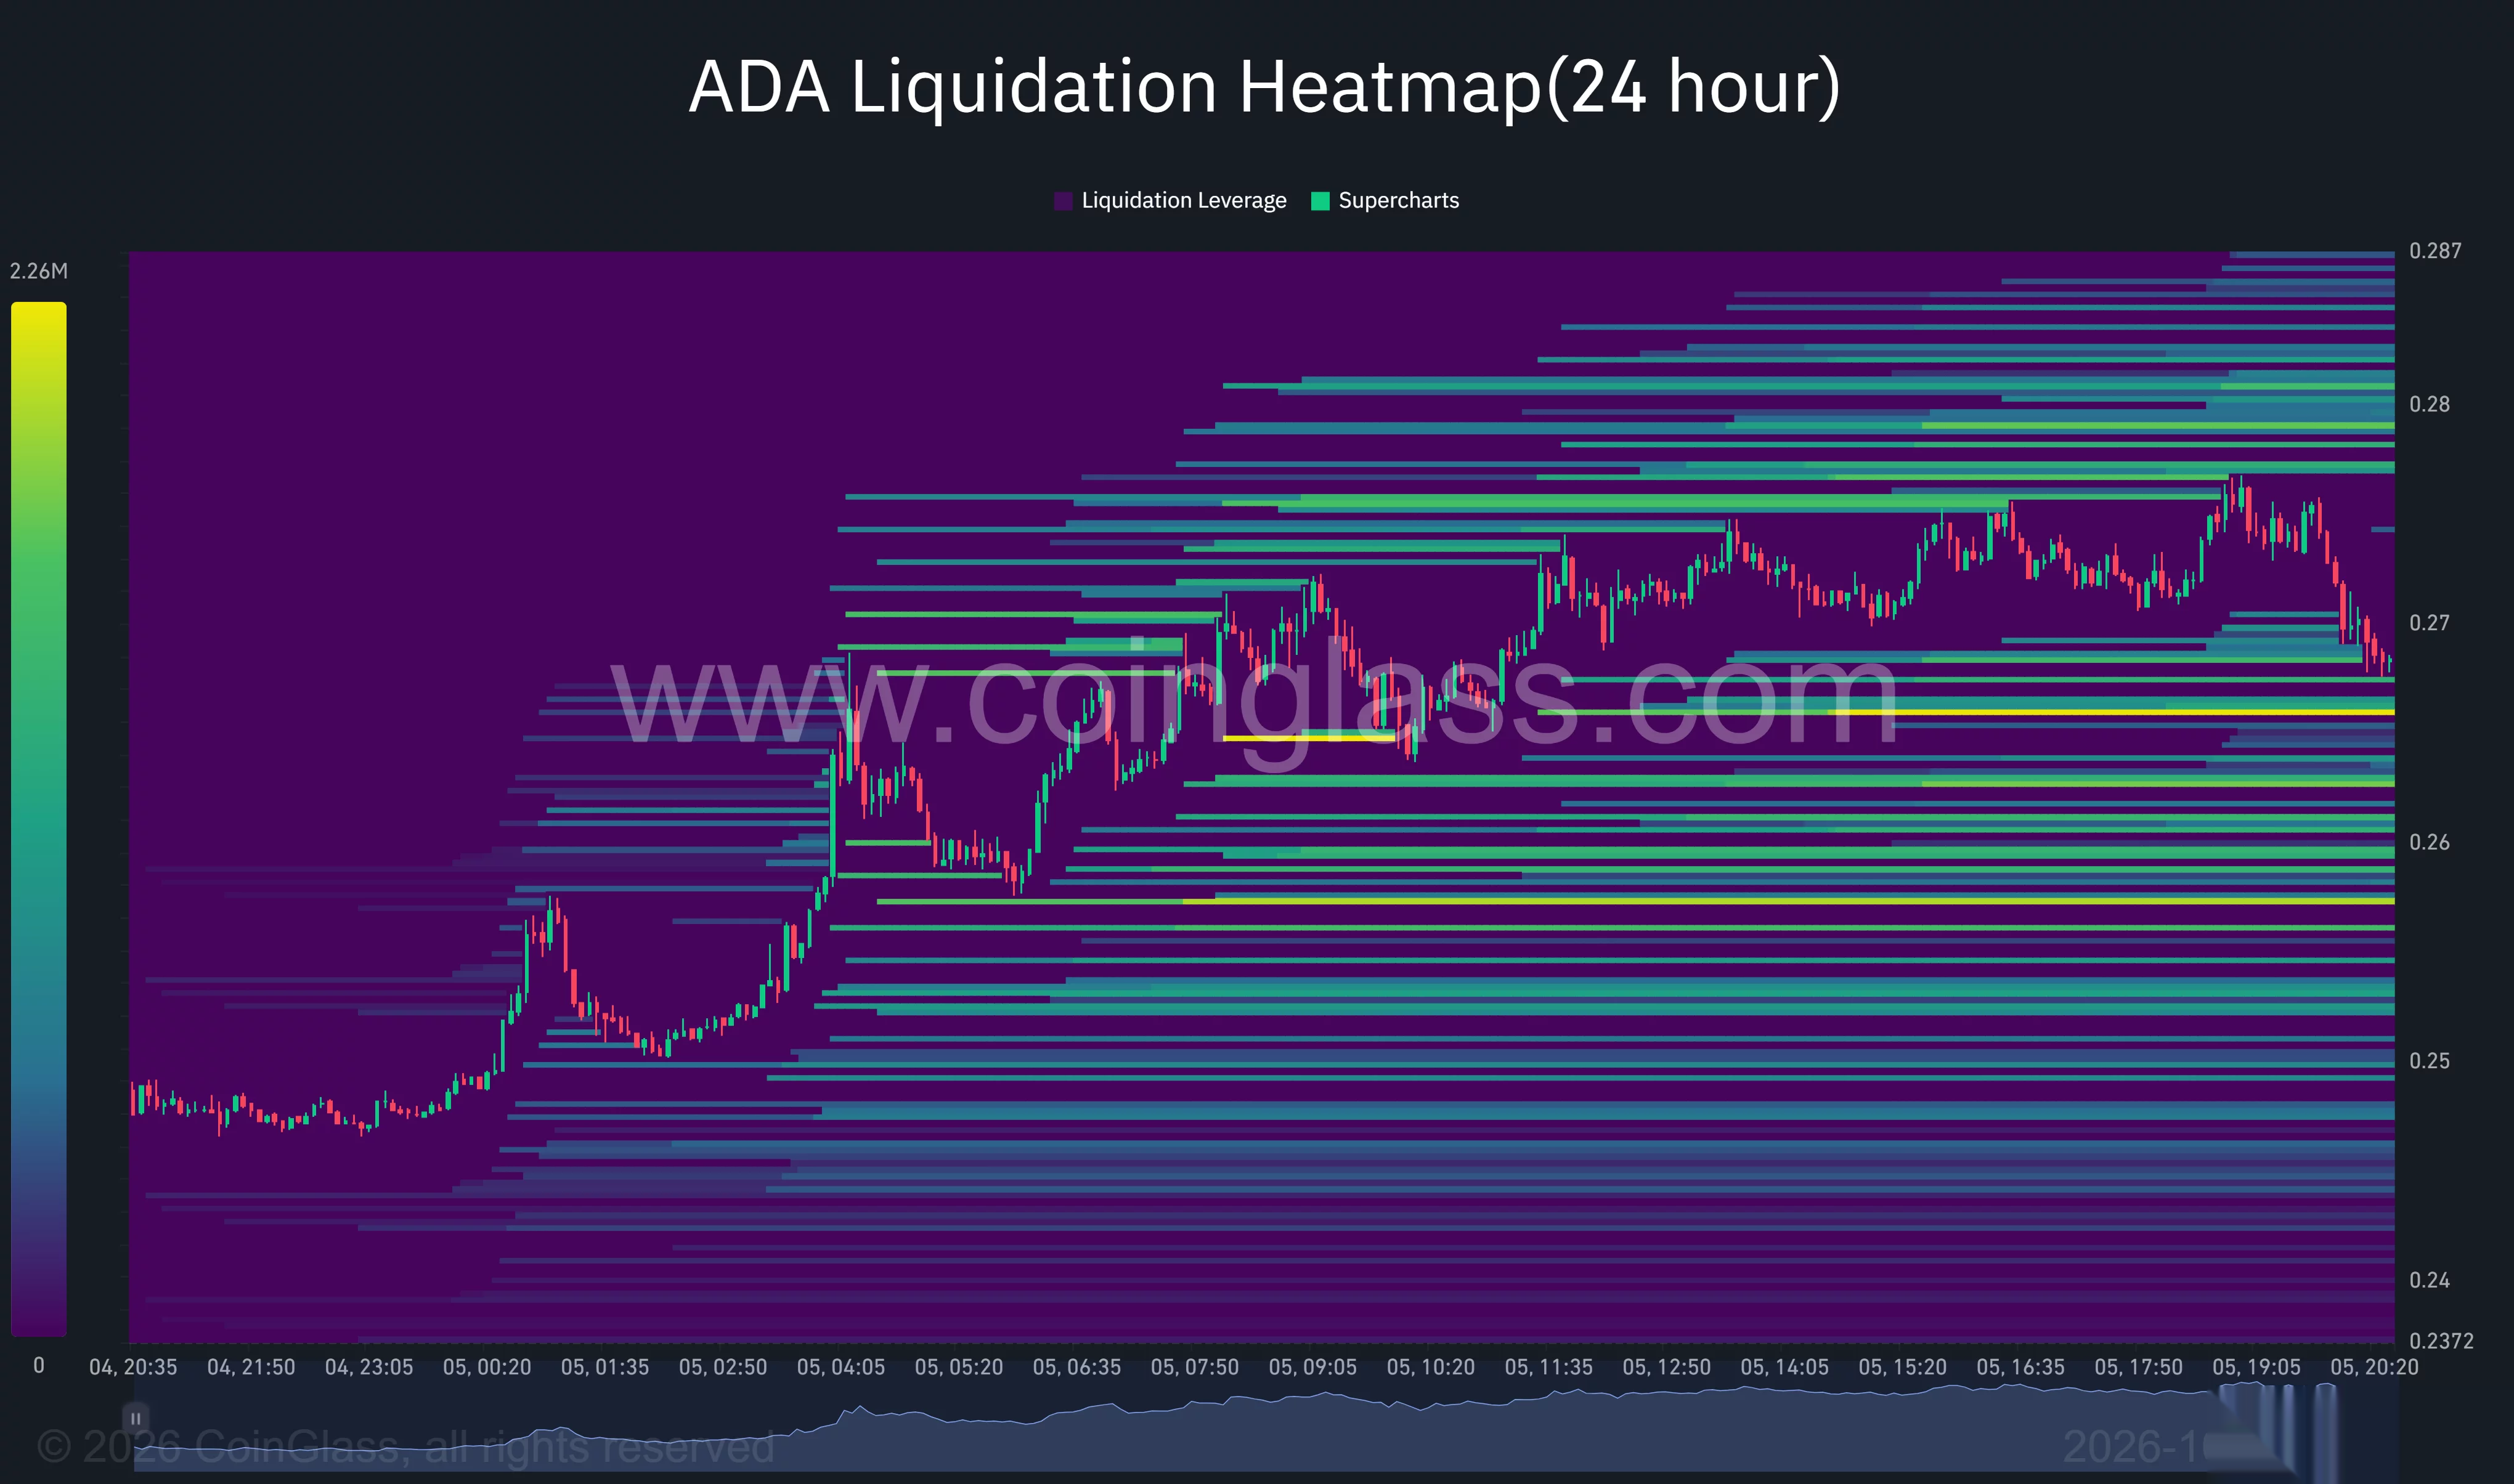
A bright liquidation band sat near $0.266, immediately below the latest price. Another strong band appeared around $0.257, with additional concentrations around $0.259–$0.263.
Above price, the heatmap showed bands around $0.275–$0.277 and $0.279–$0.281. The upper cluster overlapped with the $0.28 level in Marzell’s outlook.
TradingView’s 4-hour Supertrend remained green at $0.2498, below ADA’s market price. The same chart recorded the Average Directional Index at 24.16, rising from its recent lows toward the commonly watched 25 level for trend strength.
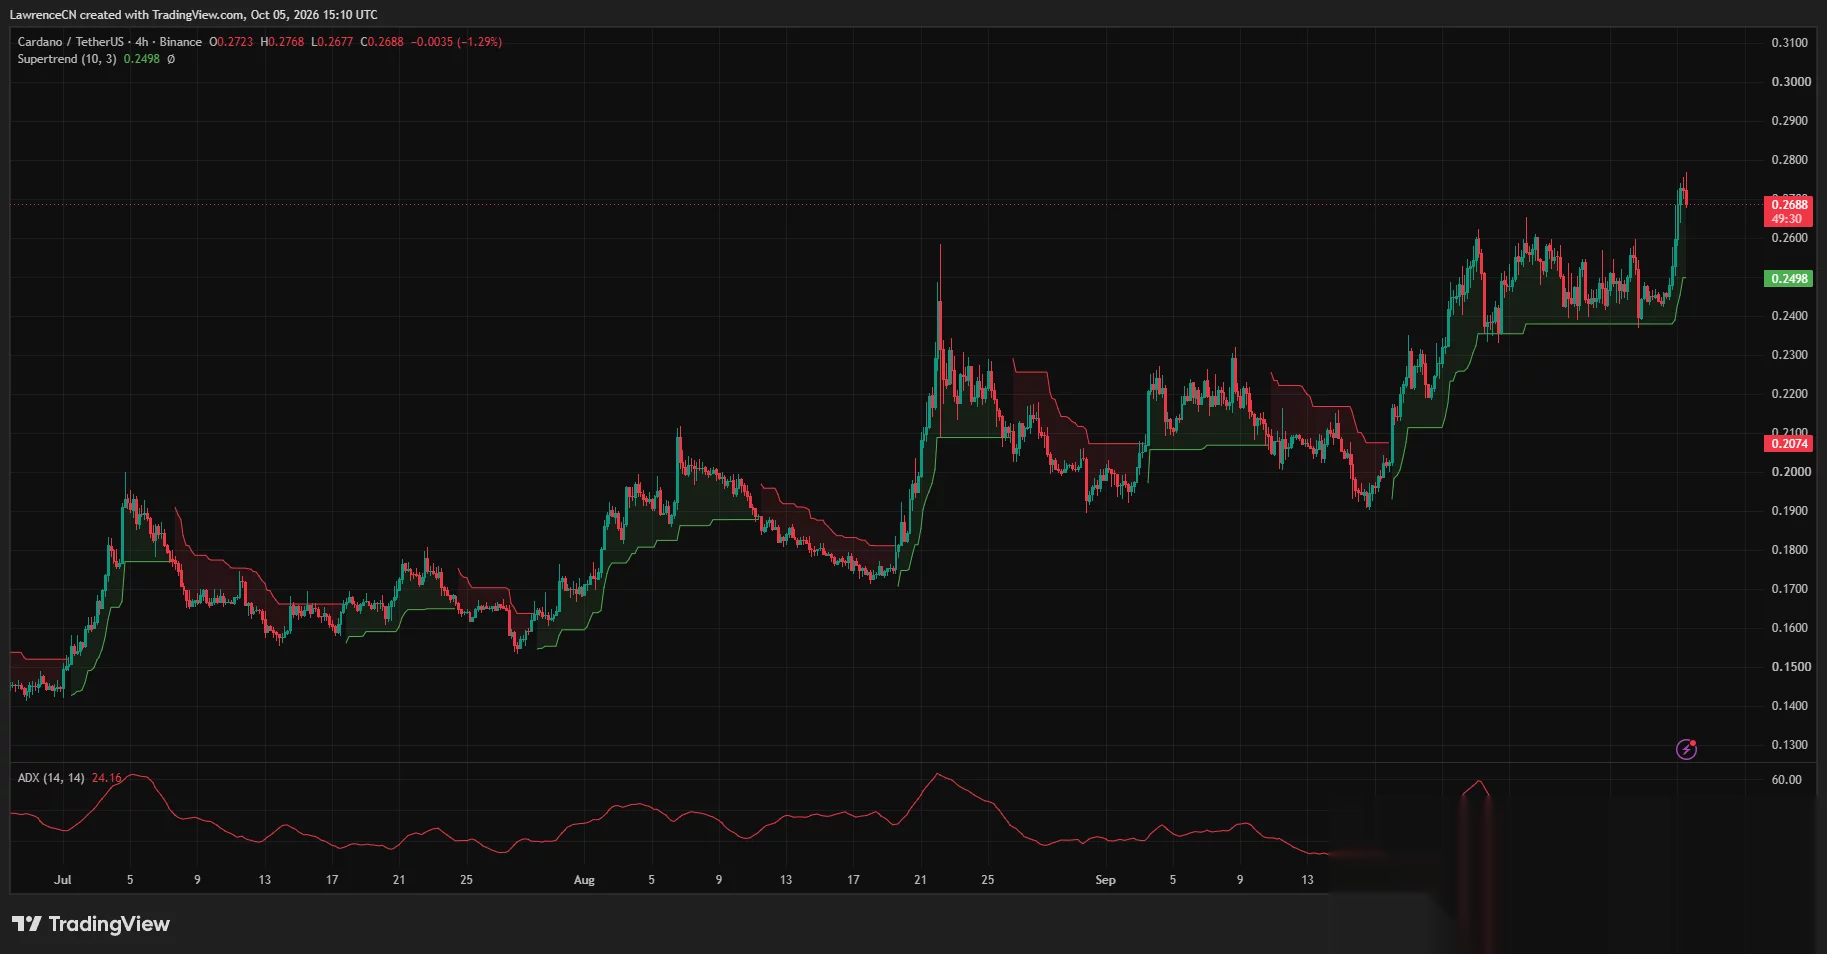
The latest 4-hour price bar showed a retreat of 1.29%, even as price remained above the Supertrend line. The bullish indicator setting therefore accompanied a pullback from the session high.
U.S. funds already include ADA in their investment universe
Hashdex’s current NCIQ product page listed Cardano at a 0.6% portfolio composition weight as of Oct. 5. The Nasdaq-listed product provides market-cap-weighted exposure to a basket of crypto assets.
Hashdex announced ADA’s inclusion effective Oct. 1, 2025, alongside Bitcoin, Ethereum, Solana, Stellar and XRP, with holdings subject to quarterly rebalancing.
T. Rowe Price’s Active Crypto ETF also listed ADA among its eligible assets in a July 14, 2026 filing. The document identified the fund’s ticker as TKNZ and its exchange as NYSE Arca.
For the immediate price setup, Marzell’s $0.27 threshold sits above ADA’s latest chart reading, while his $0.264 retest level falls below it. Patel’s broader bullish scenario remains tied to a sustained close above $0.2887.