No way, have benchmarks really evolved to this level now???
This time it's not about doing practice problems anymore—they just give the AI a set of experimental conditions and let it research on its own and predict the results of real wet-lab experiments in advance...
For example, if the same reaction is run under several different conditions, which one will yield more of the target product? Among a batch of antibody variants, which one will have higher expression levels?
The answers are hidden away first, and once the AI hands in its paper, the actual measured results are compared against it.
And you know what, this is actually something worth testing right now.
Over the past two years, the AI for Science approach has gone increasingly deep—AI can already autonomously search the literature, use software, and work continuously for hours on end to complete an analysis task.
Naturally, everyone has started moving to the next stage: What kind of scientific research capabilities do we actually want AI to have?
Wet-lab result prediction is one of the items with considerable practical value.
It requires the AI to understand the experimental goal and dig out relevant mechanisms from existing knowledge, so that it can better help researchers screen research directions worth further exploration.
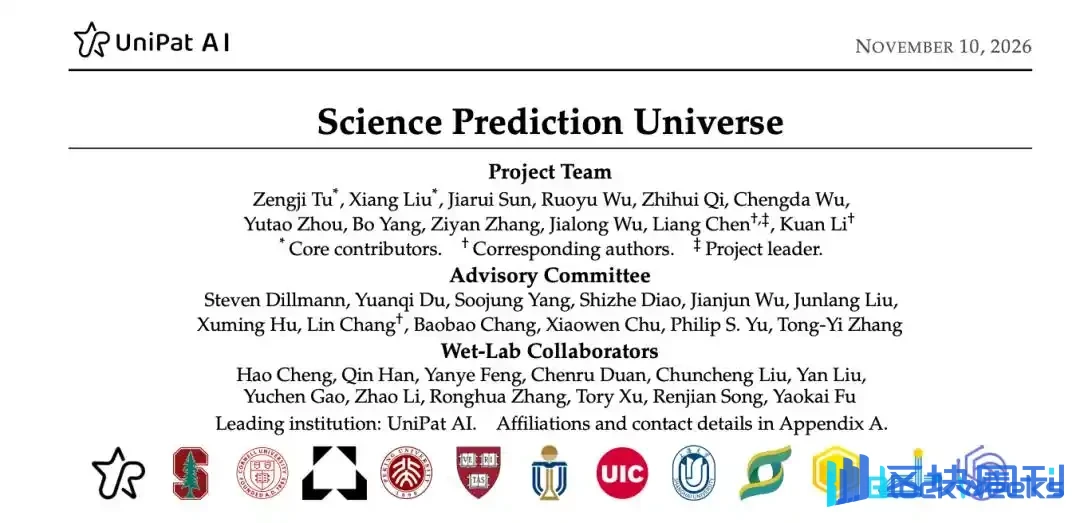
The new benchmark Science Prediction Universe (SPU for short), led and launched by UniPat AI, has keenly noticed this.
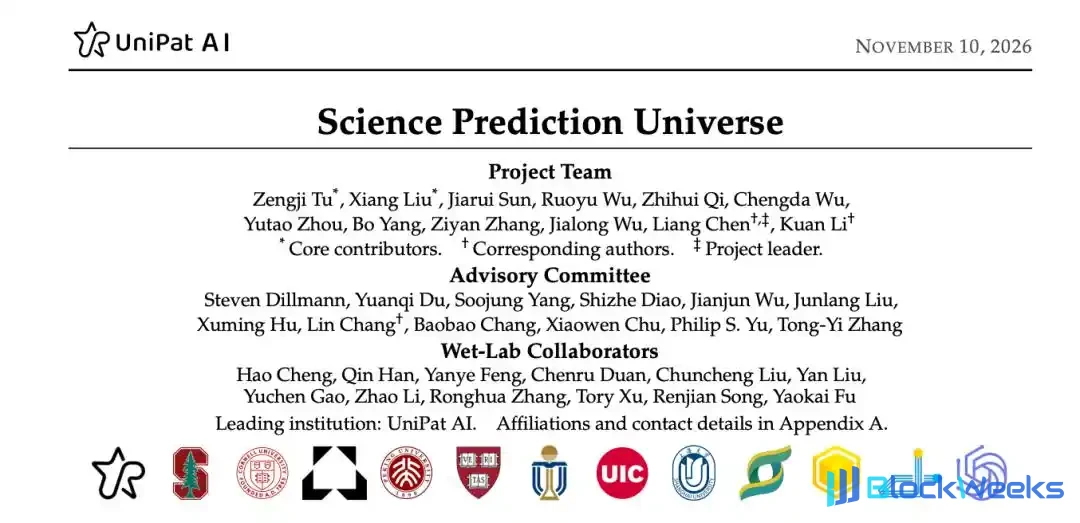
116 tasks, 4,207 wet-lab experiments, covering chemistry, materials science, biology, and medicine. The benchmark advisors and wet-lab collaborators also come from universities such as Stanford, Cornell, and Harvard, as well as cutting-edge research institutions and biotech companies in the field.
The model follows an 8-hour workday system each time, is equipped with an H20, and then autonomously decides how to use retrieval and computational resources to form experimental predictions.
The results surprised everyone.
Even strong models like Opus 5.5 and GPT-6 Astra are, according to the data, still very far from truly being able to achieve prediction...
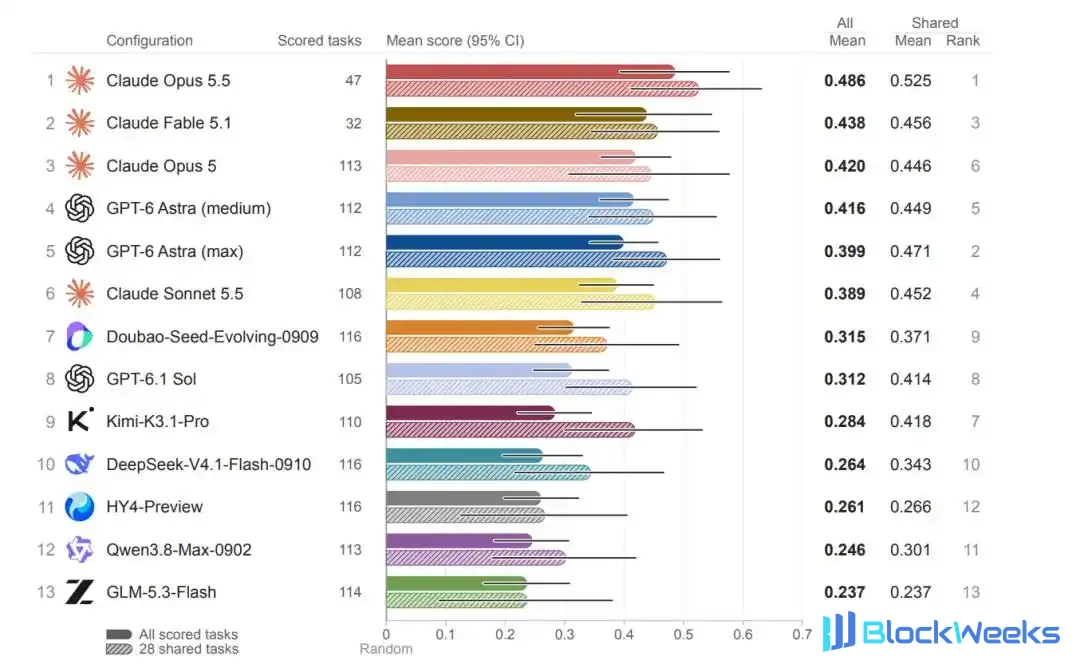
△Average scores of each configuration across all scored tasks
I have to say, SPU has served all research models a hard dish.
Those research capabilities that used to be invisible and intangible have now become numerical values that can be uniformly evaluated and continuously studied.
As for how AI's scientific judgment develops step by step, there is now a more concrete basis for discussion.
Wet-lab prediction: worth a separate exam for models
Back to wet-lab prediction—first of all, this is indeed not a new question.
There have been many such moments in the history of science: a judgment is made before the experiment, and then it is left to the process to decide—if it is right, it stays; if it is wrong, it is overturned.
The specific logic of judgment constitutes a scientist's taste.
With good enough taste and accurate enough intuition, scientists can obtain big results faster while saving precious experimental resources.
After all, just one wet-lab experiment—for chemistry, you have to prepare reagents, set reaction conditions, and then separate products; for biology, you also have to go through lengthy protein expression... The time cost and tool costs are themselves quite expensive, and if the results are not ideal, you have to do it over and over again for several rounds.
So predicting before starting is the most valuable step in the research process.

The only difference is that in the past this was done purely by scientists themselves, and now in the AI era, models also need to have this capability, and they also need a test paper that can score it.
Existing benchmarks still cannot fully cover this. For example, BrainBench lets models directly judge experimental results; ScienceAgentBench focuses on completing analysis on existing data; and long-horizon task benchmarks such as Terminal-Bench 4.0 and Long-Horizon-TB mainly use preset tests to check task outputs.
SPU is different from all of them.
It places more emphasis on testing the AI's autonomous research process together with wet-lab result prediction, involving both prediction performance and the ability to use scientific tools and execute long-horizon tasks.

△The chart was generated by AI
This kind of judgment has also been organized by SPU into clear tasks.
100 public tasks were respectively taken from 85 recently published papers. Domain experts organized candidate options, materials, conditions, and measurement methods from the research, retaining complete quantitative results as the basis for scoring.
In addition, 16 private tasks come from four groups of unpublished collaborative wet-lab experiments, involving VHH nanobodies, reaction conditions, electrolytes, and Magrolimab variants.
A total of 32 subfields and 4,207 experiments, among which public research provides interdisciplinary task sources, the measured results are hidden from the models, and the unpublished experiments add tests independent of the answers in public papers.
To a certain extent, this can prevent the models from having seen the questions in advance.

△SPU's task coverage and sources
The question selection process is also quite particular.
Experts give priority to studies with complete measurements and clear conditions; simple questions that can be ranked along a single trend are directly eliminated, and questions with values that are too close are also regarded as having little reference value.
The questions that ultimately remain are all harder and more discriminative.
During the specific prediction process, the model is required to run for eight hours each time, equipped with an 8-core CPU, 16 GiB of memory, and one H20, while being allowed to search online and install scientific research software.
During this period, the model will collect evidence on its own, choose computational methods, and finally submit the predicted ranking from low to high for each comparison group.
To prevent memory contamination, the scoring process is also conducted throughout in an independent, offline container; the AI is prohibited from retrieving the original research results, and tool outputs are automatically scanned to identify identifiers such as the source paper's DOI and title.
Finally, the system uses the Spearman correlation coefficient to compare the predicted ranking with the measured ranking.
The closer the coefficient is to 1, the closer the ranking is to the experimental results.

△SPU's evaluation process
Interestingly, SPU also pays attention to many details that benchmark tests have not considered.
For example, regarding the final score, SPU considers whether it might be due to luck, in case it was a blind cat stumbling upon a dead mouse.
So it additionally generates 4,000 random rankings for each question, uses the 95th percentile as the random-level threshold, and checks whether the model's submission significantly exceeds this reference. Different tasks also have corresponding reference bases.
The design of the entire SPU can be said to be scientifically rigorous.
The model must, step by step within it, judge for itself what is worth computing and submit its final prediction.
This design not only helps measure the current AI's wet-lab prediction capability, but also points out the direction for subsequent research teams to continuously improve experiments with the help of unified metrics.
That said, next we might as well take a look together at the report cards of the first batch of frontier models. The details are quite worth discussing separately.
The new test makes frontier models collectively break down
SPU's first round of systematic evaluation covers 12 frontier models and 13 configurations. The configurations here refer to the model, the reasoning intensity, and the model framework used.
First, let's talk about the overall results.
In one sentence: none of them are any good.
Across all scored tasks, the highest average score was Claude Opus 5.5, with 0.486 points. But even for it, only half of the tasks exceeded the random level.
Among the 13 configurations, this is almost always the case; the proportion of tasks that exceed the random-level threshold is only 34% to 52%.
In other words, all the models present still have a long way to go before truly reliable wet-lab prediction.

△Behavioral comparison analysis of the leading group and the trailing group
However, there are also differences among the models, and the average performance can be divided into two tiers:
the leading group (6 models) and the trailing group (7 models).
In same-question comparisons, the leading group on average is still about 0.15 points higher than the other seven.
There is another detail worth noting. About 9% of tasks in the leading group scored below 0, while for the other seven configurations this proportion can be as high as 22%.
Here, 0 refers to the average score of a random valid ranking; a negative score means the prediction is negatively correlated with the actual ranking.
Where exactly does the gap come from? The research team dug one step deeper.
They first combined the predictions of other models on the same question into a reference ranking, then paired the experiments two by two, compared them with the measured results, and checked whether each model individually ranked them correctly.
On experiment pairs where the reference ranking was correct, the leading group ranked them correctly 86% of the time, while the other seven configurations reached 78%; for experiment pairs where the reference ranking was wrong, both groups independently ranked them correctly at around 30%.
So in fact, part of the leading group's advantage is precisely reflected in the places where the predictions are jointly correct; in this part, the leading group is always more stable.

As for why the model deviates from the correct judgment, the run records contain more specific clues.
Take the solution task as an example. For the same polymerization reaction, 12 solvents were changed in sequence, and the task required ranking by the mass of the polymer finally separated.
Opus 5.5 scored 0.874, while Qwen3.8 scored -0.126. The 12 candidate solvent conditions were paired two by two, for a total of 66 pairs; the former ranked 56 pairs correctly, and the latter ranked 30 pairs correctly.

△Two runs of Opus and Qwen on the same task
Analysis found that this is because the two differed in the factors they focused on from the very beginning:
Qwen3.8 mainly ranked based on how much ethylene the solvent can dissolve, while Opus 5.5 paid more attention to the miscibility of the raw materials and the compatibility of the catalyst in the solvent.
Although Qwen3.8 also discovered this issue during the calculation process, it ultimately failed to directly change the ranking basis finally adopted by the model.
Therefore, the stage where prediction errors are most likely to occur is the step of choosing the judgment basis. The model also needs to learn to adjust the ranking method in real time according to the clues, so that these findings can truly affect the answer.
Broken down, these differences also vary with the specific discipline and task.
Among the scored results for each discipline in the public tasks, the highest average score in chemistry was Opus 5.5, in materials science it was Fable 5.1, in biology it was GPT-6 Astra Medium, and in medicine it was Opus 5.
P.S. Fable 5.1 and Opus 5.5 exhibited refusal-to-answer behavior.

△Scores of each model across the four disciplines
So if you are preparing to have AI participate in a certain type of research, you might first find a related task and use SPU to test it, and only proceed with formal experiments after confirming that the model is truly applicable.
The results of private tasks make this point even more concrete.
Among the 13 configurations, 12 had average scores significantly higher than random ranking, and no obvious differences were detected among the configurations. In contrast, the variation brought by different tasks was particularly striking.
For the same batch of electrolytes, when predicting ionic conductivity, the ranking correlation coefficients of the 13 configurations were concentrated in the range of 0.89 to 0.95; when switched to the electrochemical window, the scores of the 12 configurations that received scores ranged from -0.55 to 0.07, none exceeding the random-level threshold.
The model did not change, but once the measurement target changed, the score distribution clearly changed as well.
So the next time you evaluate a model, saying only that it is good at chemistry is not specific enough; you also need to see which specific measurement target and which experimental conditions it is facing.

△Prediction performance of each model on the 16 private tasks
Here is another rather counterintuitive thing:
Generally speaking, giving the model more time and higher reasoning intensity should make the score continue to rise, right?
Everyone generally thinks this way, and everyone does it this way.
But guess what? Once the SPU results came out, they directly slapped us in the face—
Under the same 8 hours of computation, the research team adjusted GPT-6 Astra from medium reasoning intensity to the highest. The median runtime at the highest intensity increased to 4.8 times, and the median API cost also increased to 5.3 times.
But the prediction score... barely moved at all.
Huh? The research team even went back specifically to look through the model run records.
And wow, on the 79 completed tasks, GPT-6 Astra at the highest reasoning intensity had usually already given an answer by the median 26% of the run.
The model was not idle afterward either; it continued calculating and revising, but these were all fine adjustments and did not show up as differences in the results.
In other words, higher reasoning intensity does not necessarily make the results better.

△GPT-6 Astra's investment and performance under two reasoning intensities
This phenomenon also serves as a reminder for model resource allocation: if you want to add computation, don't rush in blindly—it's time-consuming, labor-intensive, and may not even pay off.
Instead, you can examine the run records more carefully, first fully understanding which judgment the newly added evidence actually corresponds to, and then purposefully boost computing power locally.
In fact, a similar phenomenon also appears in tool use.
In each run, the median number of method categories used by GPT-6 Astra Max is 4, while for Medium it is 1, yet no significant difference in scores was detected between the two configurations.
The reason is much the same: good tools were not used where they mattered most.
For example, with Monte Carlo sampling, although the model calls this tool most of the time, it only adds a margin of error to the final ranking and does not directly affect the result itself.

△Scientific computing tool invocation
So in fact, using tools more is not as good as using them accurately.
GPU usage also provides an interesting perspective.
Even with sufficient GPU computing power provided, only 255 runs actually succeeded in GPU computation, less than one-fifth.
Different models and different disciplines vary in their GPU runs, so simply looking at the number of GPU invocations can hardly indicate a model's research capability.
To judge whether computing power helped, you still need to see what it was used to compute, whether the computation results helped with prediction, and how these results affected the final ranking.
The key is still to direct computing power toward the physical quantities relevant to ranking, so that the model can complete predictions more precisely.

△GPU usage statistics
Looking at cost together, the average API cost per run across configurations ranges from $0.22 to $65.91, a gap of fully 300 times.
This means SPU provides both predictive performance and invocation cost, a good reference for teams preparing to deploy research models.
From overall scores to per-question trajectories, SPU unfolds model differences into every detail of scientific judgment, such as computing power and cost.
How much the values computed by AI actually help with prediction; when a prediction goes wrong, which judgments should be re-examined... all of these can be further analyzed by combining experimental results with run records.
The next round of improvement thus has a clear direction to try:
According to SPU, the model can more promptly detect erroneous hypotheses and retain or modify rankings with more justification. After the changes, put it back into the same task to see whether predictions become more accurate.
Bringing "testing understanding" into the model's exam room
It can be said that SPU is highly consistent with the development patterns of AI4S.
AI4S evaluation is gradually deepening into real experimental stages, and benchmarks oriented toward experiment execution have also been emerging this year.
But beyond execution, prediction, as an unavoidable step in the research process and the hardest to quantify, finally has a measurable way.
The benefits are reflected in two aspects:
Researchers can thereby analyze which measurement targets are easier to predict, which tasks differ most, and how an erroneous judgment forms. This can save expensive and precious experimental resources and shorten decision time.
For model development, this also provides a more specific reference for improvement.
As the types of experiments increase, evaluation can also answer more specific questions: for which materials, experimental conditions, and measurement methods are the rankings given by AI more reliable and more worth referencing.
Scientists can thus continuously accumulate progress around the same type of questions.

In fact, SPU is only the tip of the iceberg in the UniPat AI series of real-work evaluations:
- ScienceVision: focuses on how models obtain evidence from three-dimensional scientific objects and answer questions;
- PaperBenchX: turns published research into executable, verifiable paper reproduction tasks;
- SaaS-Bench and EvoCode-Bench: respectively examine actual software processes and development work when requirements continuously change. ...
These works cover scientific research, office work, and software development, and all share a concern for how AI completes tasks after entering specific work, and how results are verified.
This also indirectly reflects that UniPat AI has unique industry insight and forward-looking judgment regarding AI's movement toward scientific research practice and even toward the real world.
UniPat AI also demonstrates a new type of AI collaboration model:
Domain experts participate in task screening and review, partner laboratories provide unpublished tasks, and the project team organizes experiments from different disciplines into unified evaluation tasks.
Taking SPU as an example, it is led by UniPat AI, and the institutions of advisory members include Stanford, Cornell, Harvard, UIC, Peking University, HKUST, and FutureHouse. Wet-lab collaborators from Yourui Saishi, Aibotaike, Deep Principle, and Enhe Biology participated in the related experimental work.
Interdisciplinary knowledge and experimental resources thus enter the same evaluation process. SPU not only carries the selection of problems, but also presents the collaboration required to organize scientific research problems into executable tasks.
Currently, the 100 public tasks related to SPU are planned to be released as complete Harbor task packages; the 16 private tasks will remain private for controlled evaluation. Both the dataset and the code have been open-sourced.
Admittedly, today's AI is still only a novice in the face of this SPU mechanism.
It can use tools at lightning speed, and within 8 hours install three sets of software, finish running DFT and then run Monte Carlo, but on the most critical judgment, it has not yet learned to ask itself one question: is the quantity I am calculating the very quantity that the experiment truly needs to measure.
But as such tasks continue to accumulate, what kind of scientific research work AI can undertake will also become clear.
SPU has measured this distance, and every subsequent exam is a record of AI moving closer to the real experimental bench.
This article comes from the WeChat public account "Quantum位" (ID: QbitAI), author: Focus on Frontier Technology