
3 altcoins have posted strong weekly gains, with SAND, NIGHT and ZRO drawing attention as traders watch key support and resistance levels.
Summary
- NIGHT trades near $0.04794, down 3.9% daily while retaining a 41.7% seven-day gain overall today.
- SAND leads the trio with a 59.2% weekly gain and trades around $0.07218 on CoinGecko.
- ZRO trades near $2.13, gaining 24.3% weekly while remaining below Ali Charts’ $2.28 resistance level.
- NIGHT’s RSI remains above 70, while SAND and ZRO indicators still show elevated momentum readings.
CoinGecko shows NIGHT near $0.04794 on Oct. 7, down 3.9% over 24 hours but up 41.7% across seven days. The token has traded between $0.04767 and $0.05072 during the past day, while daily volume stands near $26.2 million.
SAND remains the strongest weekly performer of the three. CoinGecko shows the token near $0.07218, up 10.5% over 24 hours and 59.2% over seven days. Its daily trading range stands between $0.06520 and $0.07551.
Meanwhile, ZRO trades around $2.13 after gaining 4.3% over 24 hours and 24.3% during the past week. CoinGecko reports a daily range between $2.11 and $2.29, with trading volume near $136.7 million.
The current readings differ from Ali Charts’ Oct. 6 thread because prices have changed since the analyst posted his charts. At the time, he calculated gains of roughly 51% for NIGHT, 52% for SAND and 43% for ZRO.
NIGHT holds $0.048 area as weekly rally cools
Ali Charts identified $0.052 as NIGHT’s main short-term resistance after price tested the area twice. His four-hour chart showed the token consolidating following a rise from roughly $0.032 to $0.049 and an Oct. 3 peak near $0.053.
The analyst said a four-hour close above $0.052 could open a move toward $0.060. Current CoinGecko data, however, places NIGHT around $0.04794, leaving price below the breakout level after its 3.9% daily decline.
The supplied technical chart places initial support around $0.048, followed by $0.045. NIGHT is therefore testing the first area while remaining above the stronger support identified in the setup. A sustained break below $0.045 would weaken the bullish structure described in the chart.
Momentum has cooled without fully reversing. The supplied Bollinger Bands reading puts the middle band near $0.03380 and the upper band around $0.05502. NIGHT remains well above the middle band but below the upper boundary following its recent pullback.
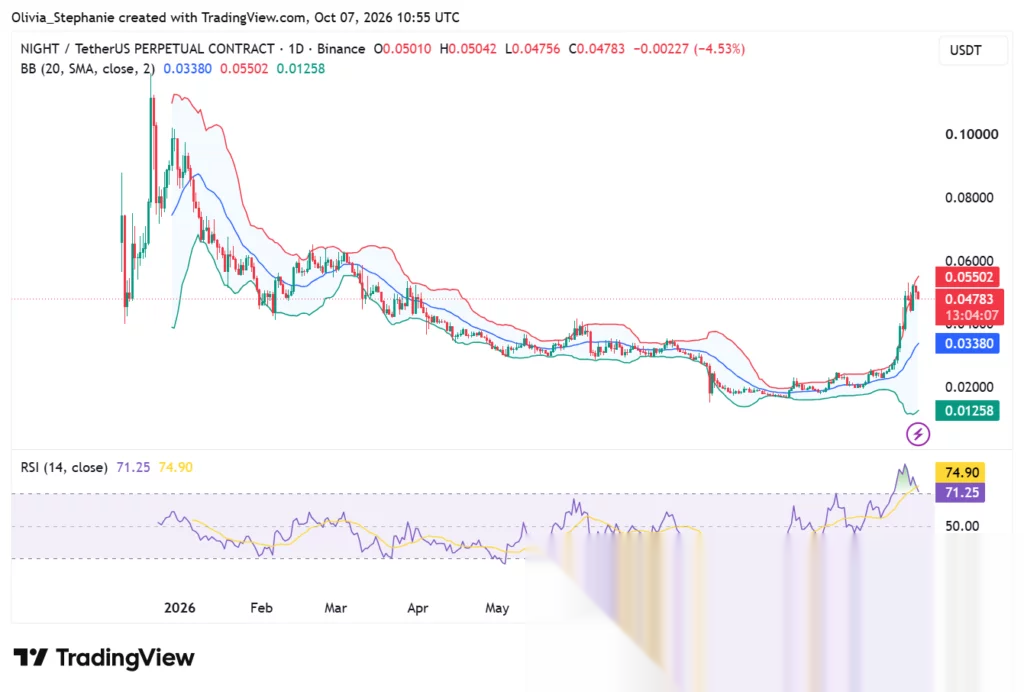
RSI sits near 71.25, while its moving average is around 74.90. A reading above 70 places the indicator in traditional overbought territory, although the recent decline from higher RSI levels shows momentum has started easing.
The rally has coincided with a network update from Midnight. The project confirmed on Sept. 28 that permissionless smart-contract deployment had gone live on mainnet. Developers can now deploy contracts without a mandatory Preprod security review.
In recent crypto.news coverage, NIGHT was trading around $0.047 on Oct. 5, with resistance identified between $0.052 and $0.055. The report placed support around $0.044 as shorter-term momentum cooled.
SAND leads weekly gains while testing $0.078
SAND has moved further than NIGHT toward the resistance identified in Ali Charts’ earlier setup. CoinGecko currently places the token at $0.07218, with its seven-day advance at 59.2%.
Ali Charts said SAND had climbed from roughly $0.043 to $0.065 before his Oct. 6 post. A TD Sequential sell signal had appeared before the token retreated from its Oct. 3 high near $0.078.
His chart later produced a TD Sequential buy signal around $0.065. The analyst identified $0.063 as the important support and said holding that level could support another attempt toward $0.077.
Price has since moved back above $0.070, according to CoinGecko, while the latest 24-hour high of $0.07551 leaves SAND just below the 0.077-0.078 resistance area.
The supplied Bollinger Bands data places the middle band near $0.05144 and the upper band around $0.07828. With SAND trading above $0.072, price remains close to the upper boundary after its latest advance.
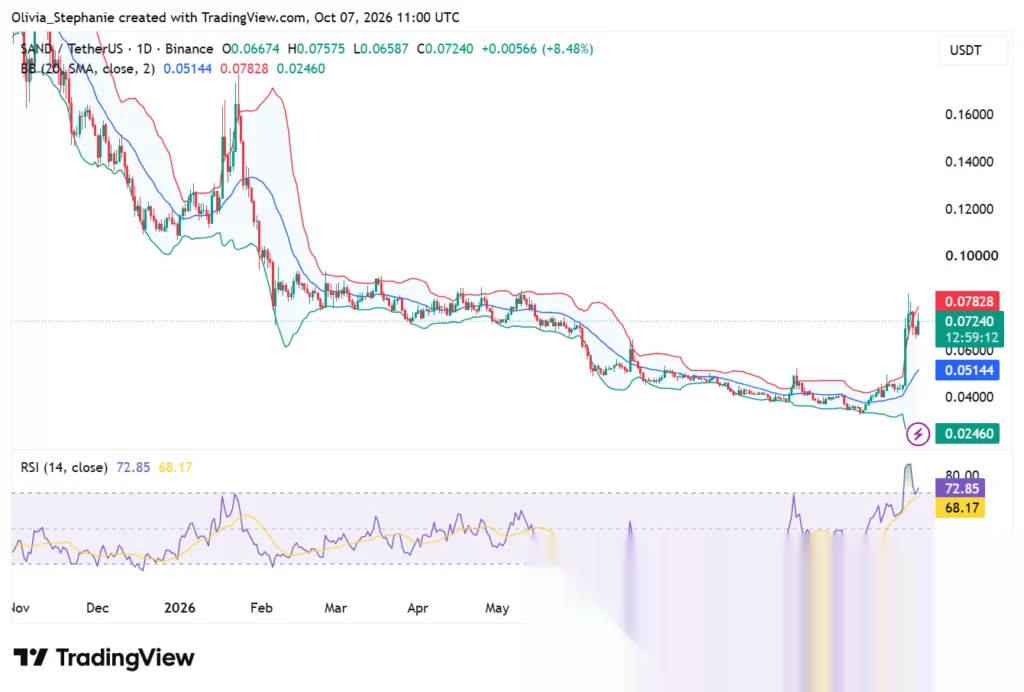
RSI stands around 72.85, compared with its moving average near 68.17. The reading remains above the traditional 70 overbought threshold, confirming elevated momentum while price approaches the technical resistance area.
Block Hunter raised a separate concern over SAND’s order book. The analyst said large buy and sell orders appeared around the same time and warned that such orders can be canceled or moved. His observation does not establish that the orders were placed to manipulate traders.
Separately, UniChartz identified a bounce from a weekly demand area. The analyst said a clean move through minor resistance could expose the upper resistance line, though that scenario remains dependent on a confirmed breakout.
CoinGecko currently carries a warning about unusual SAND minting activity on Base, saying the exact cause has not been confirmed.
The issue follows an earlier bridge incident. In related crypto.news coverage, Upbit and Bithumb placed SAND under investment caution after problems involving bridged tokens, while The Sandbox said Ethereum and Polygon balances were unaffected.
ZRO stays inside rising channel below $2.28
ZRO remains above $2 after its latest weekly advance, although its current 24.3% gain is below the 43% increase cited in Ali Charts’ Oct. 6 thread. CoinGecko places the token around $2.13 after trading as high as $2.29 during the past 24 hours.
Ali Charts identified the upper boundary of ZRO’s four-hour rising channel near $2.28. His setup called for a possible retreat toward $2 if price failed at the upper boundary.
The supplied chart places intermediate support around 2.10-2.15. With ZRO near $2.13, price is currently trading inside that area after retreating from its daily high.
A four-hour breakout above 2.28-2.30 would move price beyond the channel boundary identified by the analyst, with the supplied chart showing the next area around $2.40. Failure to hold the intermediate zone would bring the $2 level back into focus.
Momentum indicators remain positive in the supplied daily setup. MACD stands near 0.2639, above its signal line around 0.2127, while the histogram remains positive near 0.0513.
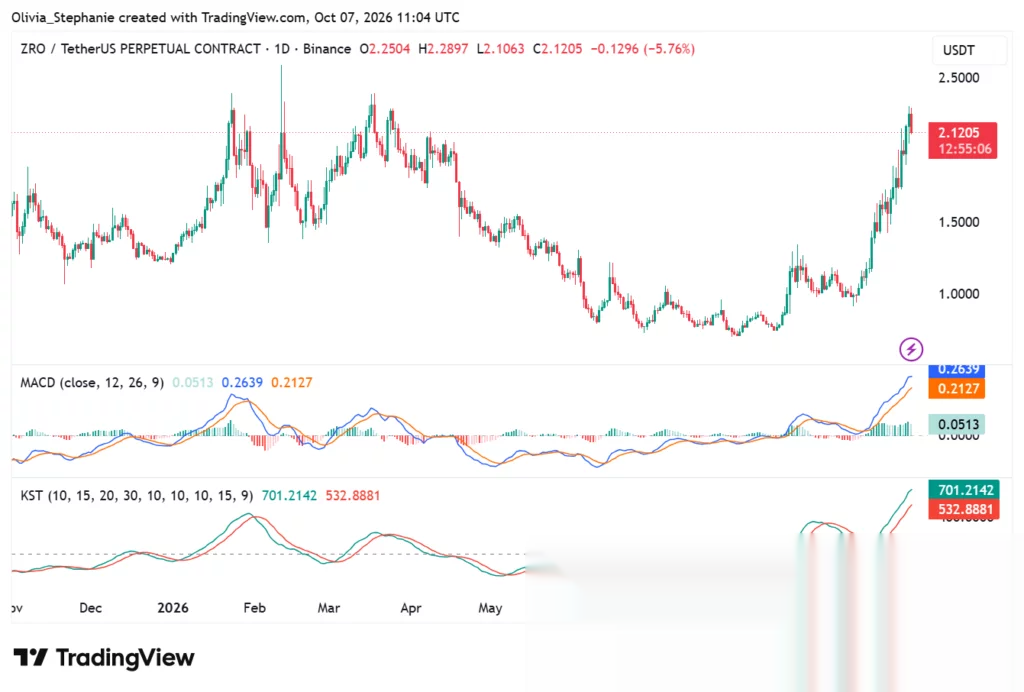
KST sits around 701.21, compared with its signal line near 532.89. Both readings preserve bullish crossovers, though they follow ZRO’s rapid advance from September levels.
In crypto.news analysis published Oct. 6, ZRO had climbed more than 100% from its early-September level near $0.99. The report placed daily resistance at $2.34 after price reached roughly $2.30.
Buybacks have provided another source of activity around ZRO. Separate crypto.news coverage reported an approximately 162,000 ZRO purchase worth around $347,000, citing on-chain monitoring. LayerZero’s official tracker had not incorporated that transaction when the report was published.
LayerZero’s next scheduled supply event is another level traders can track independently of the chart setup. Around 23.63 million ZRO are scheduled to unlock on Oct. 20, according to the token-unlock data cited in the Oct. 6 crypto.news report.